Multiple Choice
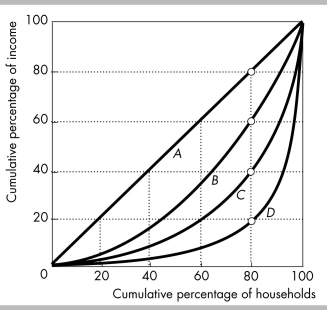
-In the figure above, the Lorenz curve that shows the richest 20 of households percent receiving 60 percent of all income is
A) curve A.
B) curve B.
C) curve C.
D) curve D.
Correct Answer:

Verified
Correct Answer:
Verified
Related Questions
Q115: Which household characteristic has the largest effect
Q116: <img src="https://d2lvgg3v3hfg70.cloudfront.net/TB8586/.jpg" alt=" -The figure above
Q117: If a Lorenz curve for income moves
Q118: Alice, Bob, and Cody live in Wesland.
Q119: Taxes and transfers in the United States<br>A)
Q121: Among the United States, Finland, and South
Q122: Income is distributed very unequally in _
Q123: A Lorenz curve graphs the<br>A) percentage of
Q124: If the area between the line of
Q125: The income distribution in the United States