Multiple Choice
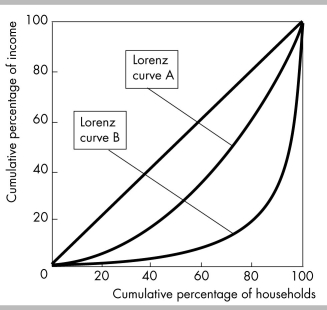
-The figure above shows two Lorenz curves, one before income redistribution and one after income redistribution. The difference between the two curves equals
A) market income.
B) money income.
C) the redistribution of income.
D) the amount of taxes paid.
Correct Answer:

Verified
Correct Answer:
Verified
Q111: <img src="https://d2lvgg3v3hfg70.cloudfront.net/TB8586/.jpg" alt=" -In the figure
Q112: Welding has changed dramatically over the last
Q113: <img src="https://d2lvgg3v3hfg70.cloudfront.net/TB8586/.jpg" alt=" -In the figure
Q114: A flat-rate income tax is also called<br>A)
Q115: Which household characteristic has the largest effect
Q117: If a Lorenz curve for income moves
Q118: Alice, Bob, and Cody live in Wesland.
Q119: Taxes and transfers in the United States<br>A)
Q120: <img src="https://d2lvgg3v3hfg70.cloudfront.net/TB8586/.jpg" alt=" -In the figure
Q121: Among the United States, Finland, and South