Multiple Choice
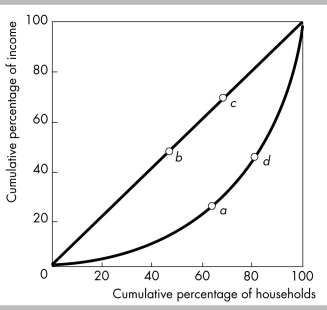
-In the above figure, the Lorenz curve for income is shown. If the data used are from the United States, and the U.S. Lorenz curve for wealth was added to the diagram, it would be
A) further from the line of equality than the Lorenz curve for income.
B) closer to the line of equality than the Lorenz curve for income.
C) above the line of equality.
D) the same as the Lorenz curve for income.
Correct Answer:

Verified
Correct Answer:
Verified
Q105: <img src="https://d2lvgg3v3hfg70.cloudfront.net/TB8586/.jpg" alt=" -The table above
Q106: The Gini ratio in Brazil was over
Q107: In the United States, the wealthiest 20
Q108: High-skilled workers earn more than low-skilled workers
Q109: <img src="https://d2lvgg3v3hfg70.cloudfront.net/TB8586/.jpg" alt=" -The above figure
Q111: <img src="https://d2lvgg3v3hfg70.cloudfront.net/TB8586/.jpg" alt=" -In the figure
Q112: Welding has changed dramatically over the last
Q113: <img src="https://d2lvgg3v3hfg70.cloudfront.net/TB8586/.jpg" alt=" -In the figure
Q114: A flat-rate income tax is also called<br>A)
Q115: Which household characteristic has the largest effect