Multiple Choice
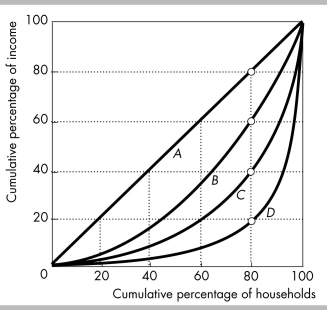
-In the figure above, line A represents the
A) the line of market income distribution.
B) line of equality.
C) line of equal number of people in each household.
D) line of equal consumption in each household.
Correct Answer:

Verified
Correct Answer:
Verified
Q108: High-skilled workers earn more than low-skilled workers
Q109: <img src="https://d2lvgg3v3hfg70.cloudfront.net/TB8586/.jpg" alt=" -The above figure
Q110: <img src="https://d2lvgg3v3hfg70.cloudfront.net/TB8586/.jpg" alt=" -In the above
Q111: <img src="https://d2lvgg3v3hfg70.cloudfront.net/TB8586/.jpg" alt=" -In the figure
Q112: Welding has changed dramatically over the last
Q114: A flat-rate income tax is also called<br>A)
Q115: Which household characteristic has the largest effect
Q116: <img src="https://d2lvgg3v3hfg70.cloudfront.net/TB8586/.jpg" alt=" -The figure above
Q117: If a Lorenz curve for income moves
Q118: Alice, Bob, and Cody live in Wesland.