Multiple Choice
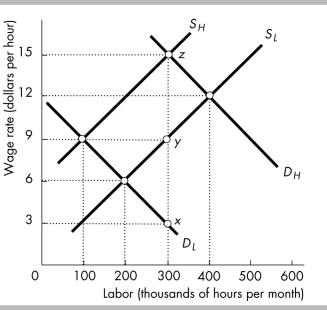
-The above figure shows the supply and demand curves for high-skilled and low-skilled labor. High-skilled workers earn a wage rate of
A) $15 per hour.
B) $12 per hour.
C) $9 per hour.
D) $6 per hour.
Correct Answer:

Verified
Correct Answer:
Verified
Related Questions
Q34: Income is distributed _ equally than wealth
Q35: In the United States, the percentage of
Q36: <img src="https://d2lvgg3v3hfg70.cloudfront.net/TB8586/.jpg" alt=" -In the figure
Q37: What is the difference between market income
Q38: When China embarked on market changes towards
Q40: The data show that an individual's wealth
Q41: In the country of Wilkes, taxes are
Q42: If a Lorenz curve for a country's
Q43: Joe earns $100,000 per year. He pays
Q44: Specialization of productive activity between men and