Essay
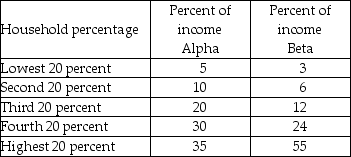
-The above table shows the distribution of income in two imaginary countries, Alpha and Beta.
a) What does the table tell you about the second 20 percent group in each country?
b) Calculate the cumulative percentage for both countries.
c) Interpret the cumulative percentage for the third 20 percent group in both countries.
Correct Answer:

Verified
Correct Answer:
Verified
Q1: <img src="https://d2lvgg3v3hfg70.cloudfront.net/TB8586/.jpg" alt=" -Using the table
Q2: Which is distributed more equally: income or
Q4: The Lorenz curve<br>A) explains why some households
Q5: A proportional income tax is defined as
Q6: <img src="https://d2lvgg3v3hfg70.cloudfront.net/TB8586/.jpg" alt=" -In the figure
Q7: <img src="https://d2lvgg3v3hfg70.cloudfront.net/TB8586/.jpg" alt=" -The above figure
Q8: A Lorenz curve measures<br>A) the benefits received
Q9: <img src="https://d2lvgg3v3hfg70.cloudfront.net/TB8586/.jpg" alt=" -The above figure
Q10: In the United States the richest 20
Q11: <img src="https://d2lvgg3v3hfg70.cloudfront.net/TB8586/.jpg" alt=" -The government in