Multiple Choice
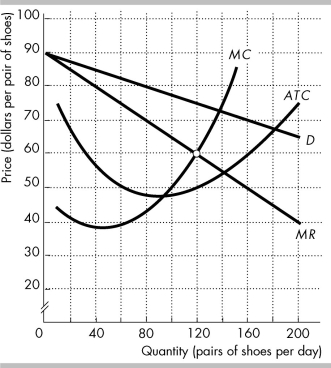 The figure shows the demand curve for Nike shoes (D) , and Nike's marginal revenue curve (MR) , marginal cost curve (MC) , and average total cost curve (ATC) .
-In the figure above, Nike's economic profit is
A) $3,000.
B) $1,800.
C) $9,000.
D) zero.
Correct Answer:

Verified
Correct Answer:
Verified
Q34: Product differentiation<br>A) is why a monopolistic competitor
Q35: <img src="https://d2lvgg3v3hfg70.cloudfront.net/TB8586/.jpg" alt=" -The above figure
Q36: The Karaoke Channel Online streams professional-grade karaoke
Q37: In monopolistic competition, product differentiation gives the
Q38: A monopolistically competitive firm will end up
Q40: The efficient scale of a firm is
Q41: A firm's markup is the amount by
Q42: A monopolistically competitive firm has _ power
Q43: Product differentiation exists within an industry if<br>A)
Q44: In monopolistic competition, each firm's marginal revenue