Multiple Choice
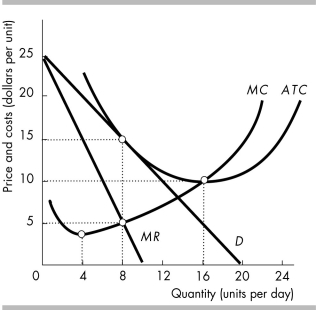
-The above figure shows the demand and cost curves for a firm in monopolistic competition in the long run. The firm maximizes its profit by
A) producing 4 units and charging a price of $15.
B) producing 8 units and charging a price of $5.
C) producing 16 units and charging a price of $10.
D) producing 8 units and charging a price of $15.
Correct Answer:

Verified
Correct Answer:
Verified
Q30: Which of the following is TRUE regarding
Q31: Monopolistic competition is a market in which
Q32: Which of the following is TRUE regarding
Q33: <img src="https://d2lvgg3v3hfg70.cloudfront.net/TB8586/.jpg" alt=" -The figure above
Q34: Product differentiation<br>A) is why a monopolistic competitor
Q36: The Karaoke Channel Online streams professional-grade karaoke
Q37: In monopolistic competition, product differentiation gives the
Q38: A monopolistically competitive firm will end up
Q39: <img src="https://d2lvgg3v3hfg70.cloudfront.net/TB8586/.jpg" alt=" The figure shows
Q40: The efficient scale of a firm is