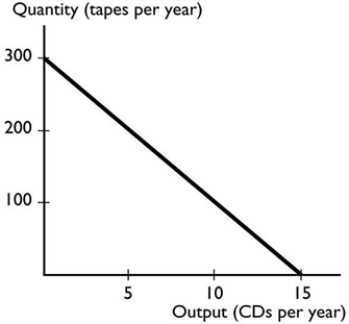
menu-iconExamlexExamLexServices

Discover

Ask a Question
  1. All Topics
  2. Topic
    Business
  3. Study Set
    Macroeconomics Australia Study Set 1
  4. Exam
    Exam 1: Getting Started
  5. Question
    The Graph Shows A
Solved

The Graph Shows A

Question 53

Question 53

Multiple Choice

  The graph shows a: A)  negative relationship that is linear. B)  negative relationship that becomes less steep. C)  positive relationship that is linear. D)  positive relationship that becomes less steep. E)  None of the above answers is correct. The graph shows a:


A) negative relationship that is linear.
B) negative relationship that becomes less steep.
C) positive relationship that is linear.
D) positive relationship that becomes less steep.
E) None of the above answers is correct.

Correct Answer:

verifed

Verified

Unlock this answer now
Get Access to more Verified Answers free of charge

Related Questions

Q4: If the change in y = -4

Q10: <img src="https://d2lvgg3v3hfg70.cloudfront.net/TB7671/.jpg" alt=" -The figure above

Q57: <img src="https://d2lvgg3v3hfg70.cloudfront.net/TB8401/.jpg" alt=" In the above,

Q65: Which of the following is a normative

Q72: A graph shows the wage rate of

Q74: When a home builder decides to computerise

Q83: The figure above shows the relationship between

Q88: Scarcity results from the fact that<br>A) not

Q111: If the marginal benefit of the next

Q112: Decision making on the margin involves<br>A) eliminating

Examlex

ExamLex

About UsContact UsPerks CenterHomeschoolingTest Prep

Work With Us

Campus RepresentativeInfluencers

Links

FaqPricingChrome Extension

Download The App

Get App StoreGet Google Play

Policies

Privacy PolicyTerms of ServiceHonor CodeCommunity Guidelines

Scan To Download

qr-code

Copyright © (2025) ExamLex LLC.

Privacy PolicyTerms Of ServiceHonor CodeCommunity Guidelines