Multiple Choice
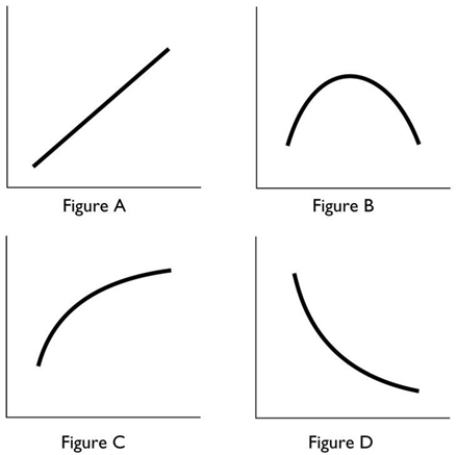 In the above, which figures show a relationship between the variables that is always positive?
A) Figures A and B
B) Figures C and D
C) Figures A, C and D
D) Figures A and C
E) Figure A only
Correct Answer:

Verified
Correct Answer:
Verified
Q4: If the change in y = -4
Q10: <img src="https://d2lvgg3v3hfg70.cloudfront.net/TB7671/.jpg" alt=" -The figure above
Q43: The figure above shows the relationship between
Q45: The primary focus of microeconomics is<br>A) to
Q53: <img src="https://d2lvgg3v3hfg70.cloudfront.net/TB8401/.jpg" alt=" The graph shows
Q76: If a curve falls and then rises,
Q83: The figure above shows the relationship between
Q93: Your lecturer changes the penalty for cheating
Q111: If the marginal benefit of the next
Q112: Decision making on the margin involves<br>A) eliminating