Multiple Choice
Use the graph to answer the following question. 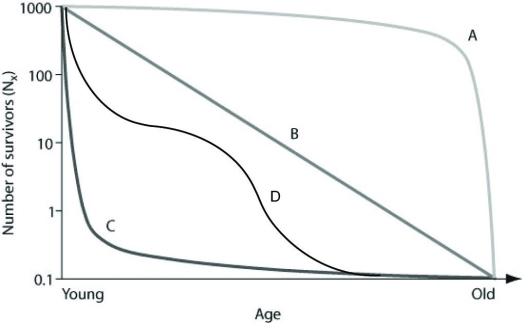 In the figure, which of the following survivorship curves is most consistent with humans who are living in developed countries where most of the population has consistent access to resources such as food, water, shelter and health care?
A) curve A
B) curve B
C) curve C
D) curve D
Correct Answer:

Verified
Correct Answer:
Verified
Q14: A population of white-footed mice becomes severely
Q15: Use the figure to answer the following
Q16: Use the hypothetical or idealized survivorship curves
Q17: An undergraduate student research assistant is attempting
Q18: Use the figures to answer the following
Q20: Which of the following is an energetic
Q21: In 2019, the United States Census Bureau
Q22: Which of the following graphs best illustrates
Q23: Use the table to answer the following
Q24: An ecologist recorded 12 white-tailed deer, Odocoileus