Multiple Choice
Use the figures to answer the following question. 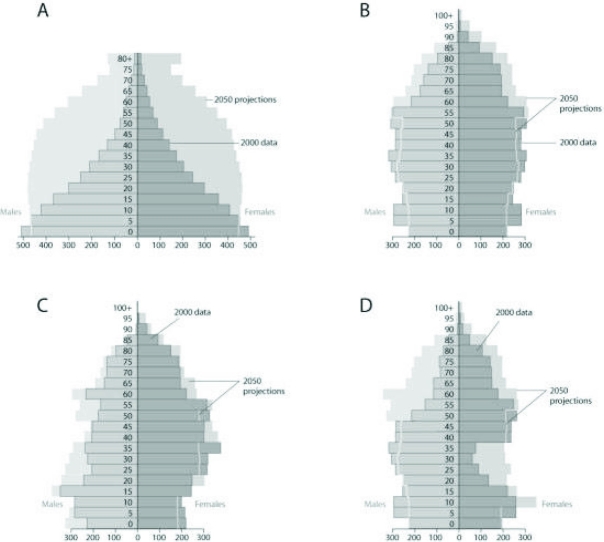 Based on the age-structure diagrams in the figure and on the large population of baby boomers (a demographic cohort born at a reproductive peak after World War II between 1946-1964 in the United States) , which graph best reflects U.S. population in 20 years?
A) A
B) B
C) C
D) D
Correct Answer:

Verified
Correct Answer:
Verified
Q13: A researcher is studying two old-growth forests
Q14: A population of white-footed mice becomes severely
Q15: Use the figure to answer the following
Q16: Use the hypothetical or idealized survivorship curves
Q17: An undergraduate student research assistant is attempting
Q19: Use the graph to answer the following
Q20: Which of the following is an energetic
Q21: In 2019, the United States Census Bureau
Q22: Which of the following graphs best illustrates
Q23: Use the table to answer the following