Multiple Choice
Use the graph to answer the following question. 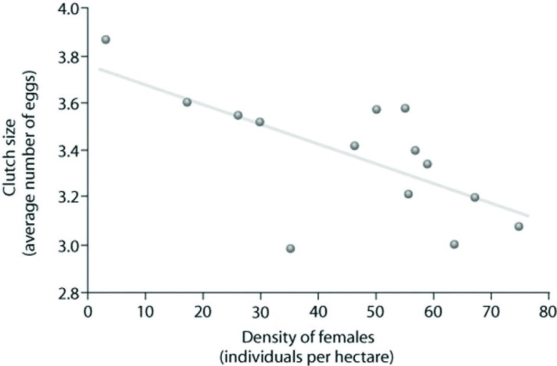 Which of the following claims can be best supported using the data?
A) Clutch size is always lowest at a density of about 35 females.
B) As female density increases, survivorship decreases.
C) Clutch size increases as female density increases.
D) Clutch size is inversely related to density.
Correct Answer:

Verified
Correct Answer:
Verified
Q61: A species population's size (N) may vary
Q62: To measure the population of lake trout
Q63: Use the figure to answer the following
Q64: Which of the following is accurate about
Q65: Which of the following techniques would most
Q67: Two breeding female fish of the same
Q68: In which of the following situations would
Q69: An undergraduate student is working in a
Q70: Use the graph to answer the following
Q71: Use the graph to answer the following