Multiple Choice
Use the following figures to answer the question below. The figure depicts average temperatures and total precipitation across the 12 months of the year. Annual precipitation in Area 1 is approximately 260 cm, and in Area 2, 10 cm. 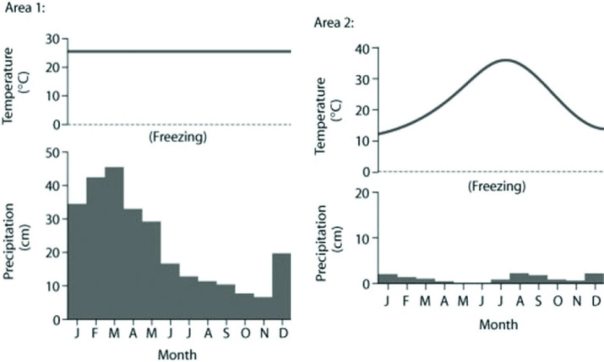 Based on the data in the figures, which of the following statements is most consistent with the data?
A) Area 1 is considered a fall-wet system.
B) Area 1 is near or in the tropics.
C) Area 1 is in mid-continental boreal forest.
D) Area 2 is in the arctic.
Correct Answer:

Verified
Correct Answer:
Verified
Q38: Which of the following would be the
Q39: Which of the following is the cause
Q40: Which of the following statements about light
Q41: After glaciers melt and shrink in size,
Q42: In deep water, which of the following
Q44: In creating global climate patterns, which of
Q45: Which aquatic biome listed here is one
Q46: Which of the following areas of study
Q47: What is most likely to happen to
Q48: Use the following figures to answer the