Multiple Choice
Use the following figures to answer the question below. The diagram is a climograph, which depicts the most likely overlap between mean temperatures and precipitation values that result in the given types of biomes. 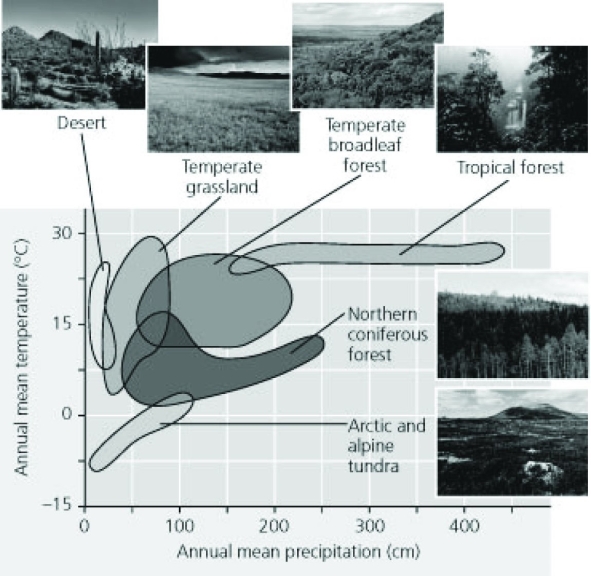 East of the Mississippi River in Hopkinsville, Kentucky, the mean annual precipitation is 130cm. The mean annual temperature is 14.3°C. In the winter, the mean temperature is 7.3°C, while in summer it is 20.6°C. Using the climograph shown here, the biome found in Hopkinsville is most likely a ________.
A) temperate rainforest
B) temperate broadleaf forest
C) shrubland during the winter, temperate forest during the summer
D) temperate forest during the winter, tropical seasonal forest during the summer
Correct Answer:

Verified
Correct Answer:
Verified
Q43: Use the following figures to answer the
Q44: In creating global climate patterns, which of
Q45: Which aquatic biome listed here is one
Q46: Which of the following areas of study
Q47: What is most likely to happen to
Q49: Turnover of water in temperate lakes during
Q50: Use the diagram showing the spread of
Q51: At 15-30°N, air masses formed over the
Q52: Which of the following is a mechanism
Q53: The main reason polar regions are cooler