Multiple Choice
The eight panels below show average climatic values across the year on a monthly basis, as represented by first letter of each month depicted on the x-axis. Temperature values are depicted as a line graph and represented by the left vertical axis, while precipitation values are depicted as a bar graph and represented by the right vertical axis. 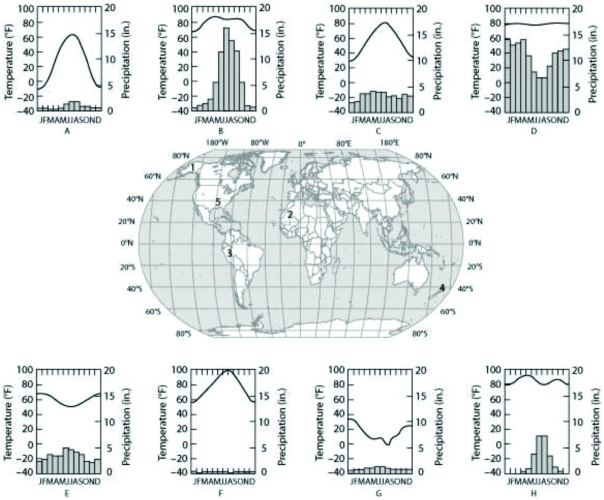 Which panel (A-H) most likely depicts the climate for location 3 as shown on the map in the center panel?
A) B
B) C
C) G
D) D
Correct Answer:

Verified
Correct Answer:
Verified
Q29: Which of the following is responsible for
Q30: Which of the following biomes spans the
Q31: Which of the following types of organisms
Q32: North-facing slopes in mountainous areas of western
Q33: Which of the following is the most
Q35: Use the following figure to answer the
Q36: Which of the following best represents an
Q37: If an ecologist were studying the regional
Q38: Which of the following would be the
Q39: Which of the following is the cause