Multiple Choice
Use the following figure to answer the question below. The shaded regions represent the expected climate conditions which give rise to the particular biomes. 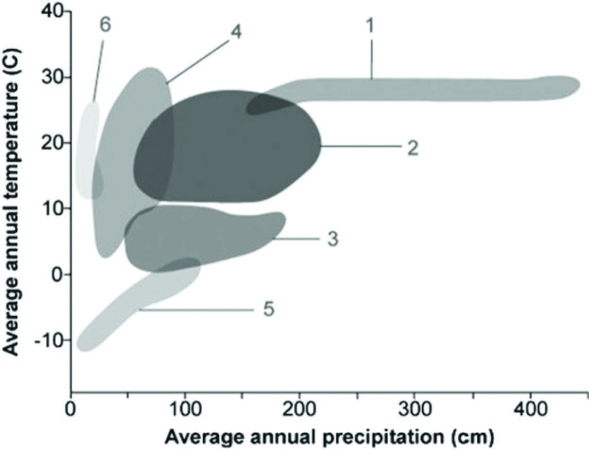 Which shaded region in the figure is the most representative of the biome with the highest variation in annual temperature?
A) 1
B) 2
C) 3
D) 4
Correct Answer:

Verified
Correct Answer:
Verified
Q30: Which of the following biomes spans the
Q31: Which of the following types of organisms
Q32: North-facing slopes in mountainous areas of western
Q33: Which of the following is the most
Q34: The eight panels below show average climatic
Q36: Which of the following best represents an
Q37: If an ecologist were studying the regional
Q38: Which of the following would be the
Q39: Which of the following is the cause
Q40: Which of the following statements about light