Multiple Choice
Draw a scatter plot of the data given in the table.
-The total in billions of dollars of U.S. exports to a particular country from 1995 to 1999 is given in the following table.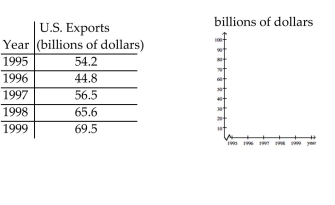
A) billions of dollars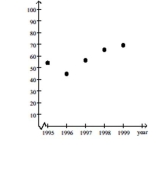
B) billions of dollars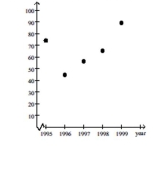
C) billions of dollars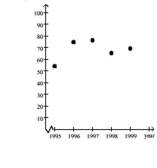
D) billions of dollars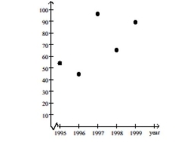
Correct Answer:

Verified
Correct Answer:
Verified
Q210: Solve the problem.<br>-The height of a box
Q211: Solve the inequality graphically.<br>- <span class="ql-formula"
Q212: Use words to describe the interval
Q213: Find the value of x and
Q214: Write the sum or difference in the
Q216: Solve the inequality and draw a
Q217: Evaluate the expression.<br>- <span class="ql-formula" data-value="|
Q218: Solve the equation using the quadratic
Q219: Find the midpoint of the line
Q220: Solve by completing the square.<br>- <span