Multiple Choice
Describe the shape of the distribution.
-A histogram for the sale prices of homes sold in one city during last year is shown below.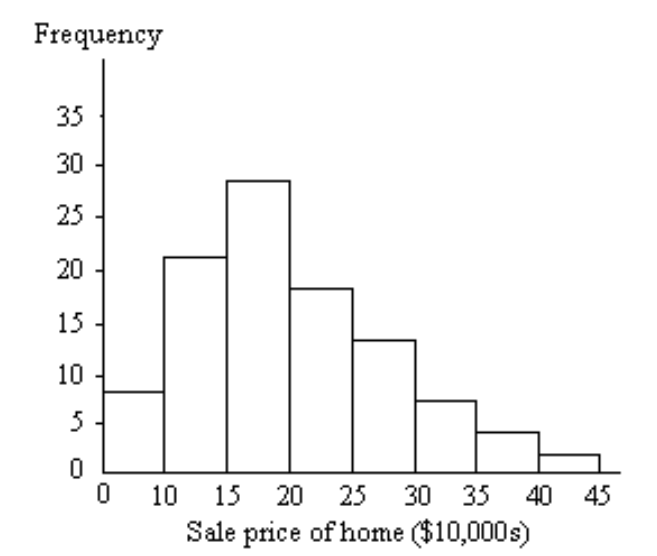
A) Left skewed, unimodal
B) Right skewed, unimodal
C) Bimodal
D) Symmetric, unimodal
Correct Answer:

Verified
Correct Answer:
Verified
Related Questions
Q78: Determine the five-number summary of the given
Q79: Find the z-score(s) bounding the region in
Q80: Determine the five-number summary of the given
Q81: Find the probability of the event.<br>-If two
Q82: Solve the problem.<br>-A physical fitness association is
Q84: Find the probability of the event.<br>-If two
Q85: Identify the following as an experiment or
Q86: Solve the problem.<br>-A box contains 4 slips
Q87: Solve the problem.<br>-The table shows the total
Q88: Find the mean for the given sample