Multiple Choice
Solve the problem.
-The table shows the total amount of precipitation (in inches) in a certain US city in 17 different years. Find the interquartile range.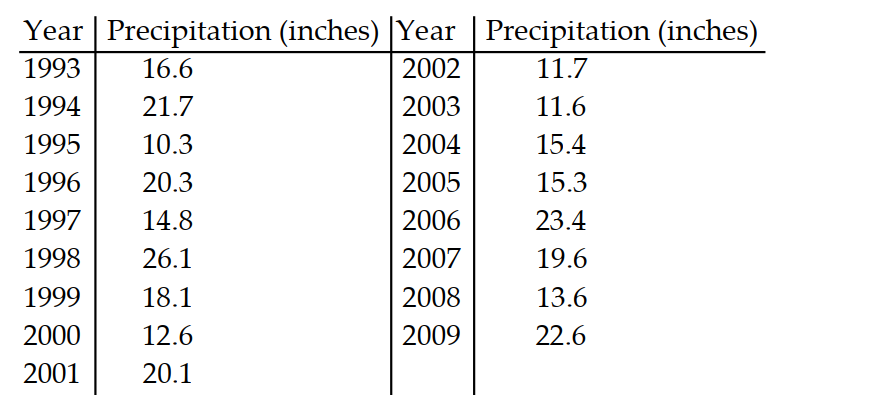
A) 7.9 in.
B) 6.7 in.
C) 7.2 in.
D) 7.4 in.
Correct Answer:

Verified
Correct Answer:
Verified
Related Questions
Q82: Solve the problem.<br>-A physical fitness association is
Q83: Describe the shape of the distribution.<br>-A histogram
Q84: Find the probability of the event.<br>-If two
Q85: Identify the following as an experiment or
Q86: Solve the problem.<br>-A box contains 4 slips
Q88: Find the mean for the given sample
Q89: Find the median for the given sample
Q90: Identify whether the number described is a
Q91: Identify the following as an experiment or
Q92: Find the probability.<br>-A 5-card hand is dealt