Multiple Choice
Figure 11-3
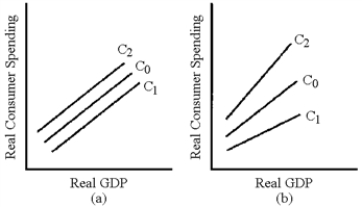
-In Figure 11-3, which line represents the change in the consumption schedule caused by an increase in the residential property tax?
A) C1 in graph (a)
B) C2 in graph (a)
C) C1 in graph (b)
D) C2 in graph (b)
Correct Answer:

Verified
Correct Answer:
Verified
Q40: Why does a tax change affect aggregate
Q169: If a state government reduces property taxes
Q171: Expansionary fiscal policy can cause a rise
Q172: In the determination of disposable income, transfer
Q173: Figure 11-2<br> <img src="https://d2lvgg3v3hfg70.cloudfront.net/TB8592/.jpg" alt="Figure 11-2
Q175: Critics of supply-side economics argue that a
Q176: Figure 11-3<br> <img src="https://d2lvgg3v3hfg70.cloudfront.net/TB8592/.jpg" alt="Figure 11-3
Q177: Government purchases have the same multiplier effect
Q178: Why did President George W.Bush feel the
Q179: Figure 11-2<br> <img src="https://d2lvgg3v3hfg70.cloudfront.net/TB8592/.jpg" alt="Figure 11-2