Multiple Choice
Table 10-1 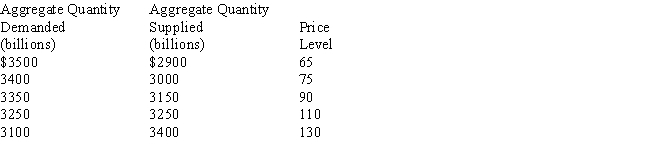
-In Table 10-1, what is the equilibrium level of real output and the equilibrium price?
A) $3,100 real output and a price of 75
B) $3,250 real output and a price of 110
C) $3,350 real output and a price of 90
D) $3,400 real output and a price of 75
Correct Answer:

Verified
Correct Answer:
Verified
Q59: The aggregate supply curve shows the relationship
Q60: Figure 10-8<br> <img src="https://d2lvgg3v3hfg70.cloudfront.net/TB8592/.jpg" alt="Figure 10-8
Q61: If the prices of inputs change, what
Q62: The aggregate supply curve slopes<br>A)downward because firms
Q63: An equilibrium point beyond a potential GDP
Q65: Figure 10-1<br> <img src="https://d2lvgg3v3hfg70.cloudfront.net/TB8592/.jpg" alt="Figure 10-1
Q66: A period of stagflation is part of
Q67: Table 10-1 <img src="https://d2lvgg3v3hfg70.cloudfront.net/TB8592/.jpg" alt="Table 10-1
Q68: Stagflation is the typical result of adverse
Q69: The combination of high unemployment and high