Multiple Choice
Figure 10-8
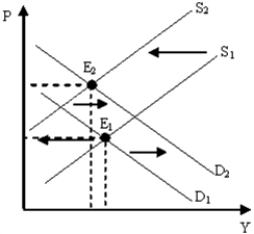
-Figure 10-8 describes which of the following periods in the United States?
A) 1930s
B) 1973-1975
C) late 1990s
D) 2007-2009
Correct Answer:

Verified
Correct Answer:
Verified
Related Questions
Q55: The underlying cause of inflation is<br>A)labor unions
Q56: The price of imported oil decreased in
Q57: The years 2002 through 2007 can be
Q58: For any given growth rate of aggregate
Q59: The aggregate supply curve shows the relationship
Q61: If the prices of inputs change, what
Q62: The aggregate supply curve slopes<br>A)downward because firms
Q63: An equilibrium point beyond a potential GDP
Q64: Table 10-1 <img src="https://d2lvgg3v3hfg70.cloudfront.net/TB8592/.jpg" alt="Table 10-1
Q65: Figure 10-1<br> <img src="https://d2lvgg3v3hfg70.cloudfront.net/TB8592/.jpg" alt="Figure 10-1