Multiple Choice
A student counted the number of candies of each color in a bag of 57 Reese's Pieces.The results are shown in the bar graph. 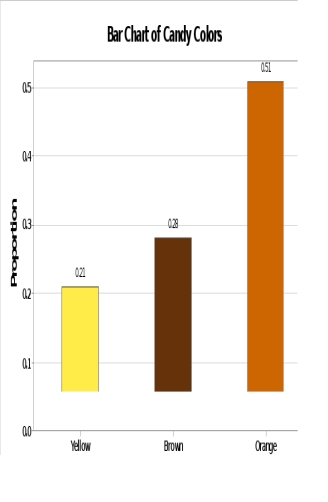 What percentage of the candies were not colored orange?
A) 21%
B) 28%
C) 49%
D) 51%
Correct Answer:

Verified
Correct Answer:
Verified
Q8: <img src="https://d2lvgg3v3hfg70.cloudfront.net/TB8195/.jpg" alt=" This stem-and-leaf plot
Q9: Relative frequency is best suited to describing
Q10: <img src="https://d2lvgg3v3hfg70.cloudfront.net/TB8195/.jpg" alt=" This stem-and-leaf plot
Q11: A student counted the number of candies
Q12: <img src="https://d2lvgg3v3hfg70.cloudfront.net/TB8195/.jpg" alt=" The shape of
Q14: A numeric data set is _ if
Q15: Concerning qualitative data, the _ of a
Q16: If there are more than two observations
Q17: <img src="https://d2lvgg3v3hfg70.cloudfront.net/TB8195/.jpg" alt=" What data value
Q18: A numerical data set is _ if