Multiple Choice
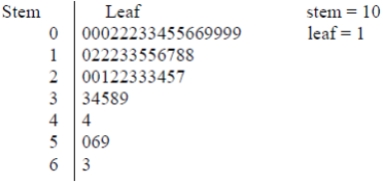 This stem-and-leaf plot shows the lengths of reigns (in years) of the British monarchs.According to the plot, how many British rulers had reigns that lasted 32 years?
A) 0
B) 1
C) 2
D) 3
Correct Answer:

Verified
Correct Answer:
Verified
Q5: <img src="https://d2lvgg3v3hfg70.cloudfront.net/TB8195/.jpg" alt=" What data value
Q6: <img src="https://d2lvgg3v3hfg70.cloudfront.net/TB8195/.jpg" alt=" Judging from this
Q7: <img src="https://d2lvgg3v3hfg70.cloudfront.net/TB8195/.jpg" alt=" What is the
Q8: <img src="https://d2lvgg3v3hfg70.cloudfront.net/TB8195/.jpg" alt=" This stem-and-leaf plot
Q9: Relative frequency is best suited to describing
Q11: A student counted the number of candies
Q12: <img src="https://d2lvgg3v3hfg70.cloudfront.net/TB8195/.jpg" alt=" The shape of
Q13: A student counted the number of candies
Q14: A numeric data set is _ if
Q15: Concerning qualitative data, the _ of a