True/False
TABLE 2-18
The stem-and-leaf display below shows the result of a survey on 50 students on their satisfaction with their school with the higher scores represent higher level of satisfaction.
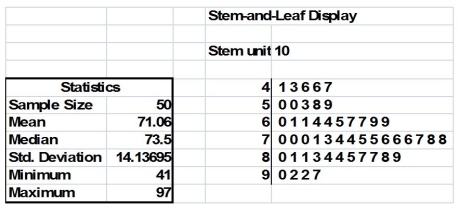
-Referring to Table 2-18, if a student is randomly selected, his/her most likely level of satisfaction among the 40s, 50s, 60s, 70s, 80s and 90s will be in the 70s.
Correct Answer:

Verified
Correct Answer:
Verified
Q7: TABLE 2-14<br>The table below contains the number
Q15: TABLE 2-15<br>The figure below is the ogive
Q17: Data on the number of credit hours
Q19: TABLE 2-15<br>The figure below is the ogive
Q36: TABLE 2-12<br>The table below contains the opinions
Q75: TABLE 2-14<br>The table below contains the number
Q98: A polygon can be constructed from a
Q173: TABLE 2-14<br>The table below contains the number
Q198: TABLE 2-12<br>The table below contains the opinions
Q202: TABLE 2-10<br>The histogram below represents scores achieved