Multiple Choice
TABLE 2-15
The figure below is the ogive for the amount of fat (in grams) for a sample of 36 pizza products where the upper boundaries of the intervals are: 5, 10, 15, 20, 25, and 30.
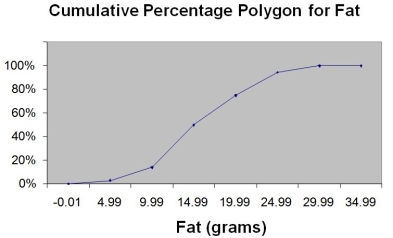
-Referring to Table 2-15, what percentage of pizza products contain at least 20 grams of fat?
A) 5%
B) 25%
C) 75%
D) 96%
Correct Answer:

Verified
Correct Answer:
Verified
Q14: TABLE 2-18<br>The stem-and-leaf display below shows the
Q15: TABLE 2-15<br>The figure below is the ogive
Q17: Data on the number of credit hours
Q57: TABLE 2-12<br>The table below contains the opinions
Q84: TABLE 2-14<br>The table below contains the number
Q99: TABLE 2-12<br>The table below contains the opinions
Q151: TABLE 2-4<br>A survey was conducted to determine
Q155: TABLE 2-12<br>The table below contains the opinions
Q173: TABLE 2-14<br>The table below contains the number
Q202: TABLE 2-10<br>The histogram below represents scores achieved