Multiple Choice
TABLE 12-2
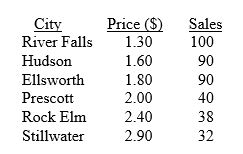
A candy bar manufacturer is interested in trying to estimate how sales are influenced by the price of their product. To do this, the company randomly chooses six small cities and offers the candy bar at different prices. Using candy bar sales as the dependent variable, the company will conduct a simple linear regression on the data below:
 .
.
-Referring to Table 12-2, what is the percentage of the total variation in candy bar sales explained by the regression model?
A) 100%
B) 88.54%
C) 78.39%
D) 48.19%
Correct Answer:

Verified
Correct Answer:
Verified
Q34: TABLE 12-2<br>A candy bar manufacturer is interested
Q35: TABLE 12-5<br>The managing partner of an advertising
Q36: TABLE 12-12<br>The manager of the purchasing department
Q37: What do we mean when we say
Q38: TABLE 12-1<br>A large national bank charges local
Q40: TABLE 12-12<br>The manager of the purchasing department
Q41: TABLE 12-11<br>A computer software developer would like
Q42: TABLE 12-13<br>In this era of tough economic
Q43: TABLE 12-9<br>It is believed that, the average
Q44: TABLE 12-10<br>The management of a chain electronic