True/False
TABLE 12-10
The management of a chain electronic store would like to develop a model for predicting the weekly sales (in thousand of dollars) for individual stores based on the number of customers who made purchases. A random sample of 12 stores yields the following results:
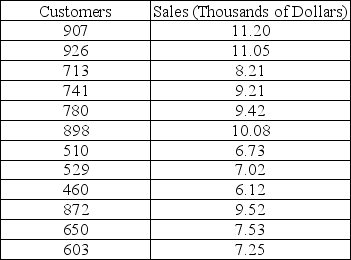
-Referring to Table 12-10, 93.98% of the total variation in weekly sales can be explained by the variation in the number of customers who make purchases.
Correct Answer:

Verified
Correct Answer:
Verified
Q39: TABLE 12-2<br>A candy bar manufacturer is interested
Q40: TABLE 12-12<br>The manager of the purchasing department
Q41: TABLE 12-11<br>A computer software developer would like
Q42: TABLE 12-13<br>In this era of tough economic
Q43: TABLE 12-9<br>It is believed that, the average
Q45: TABLE 12-3<br>The director of cooperative education at
Q46: TABLE 12-9<br>It is believed that, the average
Q47: TABLE 12-13<br>In this era of tough economic
Q49: TABLE 12-10<br>The management of a chain electronic
Q191: The Y-intercept (b₀) represents the<br>A) predicted value