Multiple Choice
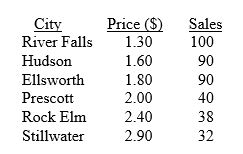
TABLE 12-2
A candy bar manufacturer is interested in trying to estimate how sales are influenced by the price of their product. To do this, the company randomly chooses six small cities and offers the candy bar at different prices. Using candy bar sales as the dependent variable, the company will conduct a simple linear regression on the data below:
 .
.
-Referring to Table 12-2, what percentage of the total variation in candy bar sales is explained by the prices?
A) 100%
B) 88.54%
C) 78.39%
D) 48.19%
Correct Answer:

Verified
Correct Answer:
Verified
Q102: TABLE 12-5<br>The managing partner of an advertising
Q103: TABLE 12-10<br>The management of a chain electronic
Q104: TABLE 12-10<br>The management of a chain electronic
Q105: TABLE 12-13<br>In this era of tough economic
Q106: TABLE 12-13<br>In this era of tough economic
Q108: TABLE 12-10<br>The management of a chain electronic
Q109: TABLE 12-5<br>The managing partner of an advertising
Q110: TABLE 12-4<br>The managers of a brokerage firm
Q111: TABLE 12-7<br>An investment specialist claims that if
Q112: TABLE 12-9<br>It is believed that, the average