Multiple Choice
For Questions , use the following narrative
Narrative: Crickets and temperature
A researcher wants to explore the relationship between cricket chirps and temperature.The following scatterplot shows data collected over a random sample of 8 days.Each day, the temperature was recorded, as well as the number of times a cricket chirped in 15 seconds.The correlation was found to be over .90.The least squares line was found to be Temperature (in Fahrenheit) = 40 + 1.0 × (#Chirps in 15 seconds) . 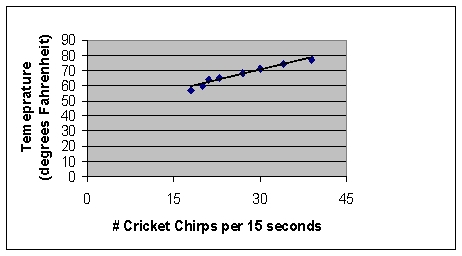
-{Crickets and temperature narrative} For about what range of cricket chirps can the researcher feel comfortable about making temperature predictions?
A) 15-40 chirps per 15 seconds
B) 60-80 degrees
C) 0-40 chirps per 15 seconds
D) Any range is acceptable.
Correct Answer:

Verified
Correct Answer:
Verified
Q25: Determine whether or not the following statement
Q26: For Questions , use the following narrative<br>Narrative:
Q27: Suppose a researcher examined 100 possible relationships
Q28: Which of the following describes a strong
Q29: Correlation measures the strength of a certain
Q30: Which of the following statements is true?<br>A)If
Q31: Assuming there is a statistical relationship between
Q32: Explain why 5% of all relationships that
Q33: Which of the following describes a 'detrended'
Q34: Determine whether or not the following statement