Multiple Choice
TABLE 13-5
A microeconomist wants to determine how corporate sales are influenced by capital and wage spending by companies. She proceeds to randomly select 26 large corporations and record information in millions of dollars. The Microsoft Excel output below shows results of this multiple regression.
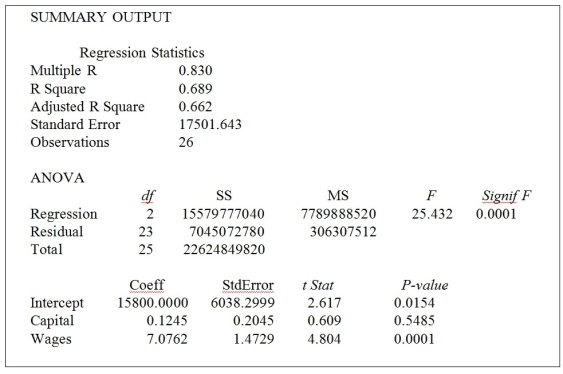
-Referring to Table 13-5, when the microeconomist used a simple linear regression model with sales as the dependent variable and wages as the independent variable, she obtained an r² value of 0.601. What additional percentage of the total variation of sales has been explained by including capital spending in the multiple regression?
A) 60.1%
B) 31.1%
C) 22.9%
D) 8.8%
Correct Answer:

Verified
Correct Answer:
Verified
Q1: Consider a regression in which b₂ =
Q13: TABLE 13-7<br>The department head of the accounting
Q14: TABLE 13-14<br>An automotive engineer would like to
Q15: TABLE 13-5<br>A microeconomist wants to determine how
Q16: TABLE 13-6<br>One of the most common questions
Q17: TABLE 13-15<br>The superintendent of a school district
Q20: TABLE 13-5<br>A microeconomist wants to determine how
Q21: TABLE 13-17<br>Given below are results from the
Q22: TABLE 13-17<br>Given below are results from the
Q23: TABLE 13-4<br>A real estate builder wishes to