Multiple Choice
TABLE 13-6
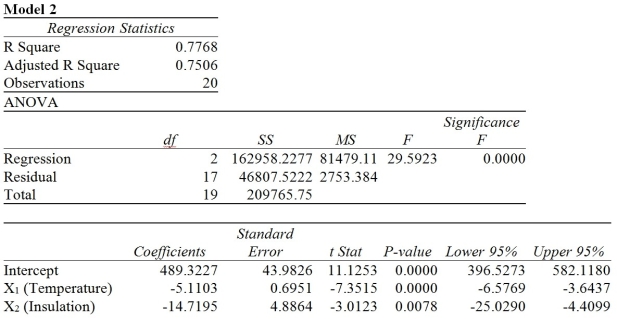
One of the most common questions of prospective house buyers pertains to the cost of heating in dollars (Y) . To provide its customers with information on that matter, a large real estate firm used the following four variables to predict heating costs: the daily minimum outside temperature in degrees of Fahrenheit (X1) , the amount of insulation in inches (X2) , the number of windows in the house (X3) , and the age of the furnace in years (X4) . Given below are the Microsoft Excel outputs of two regression models.
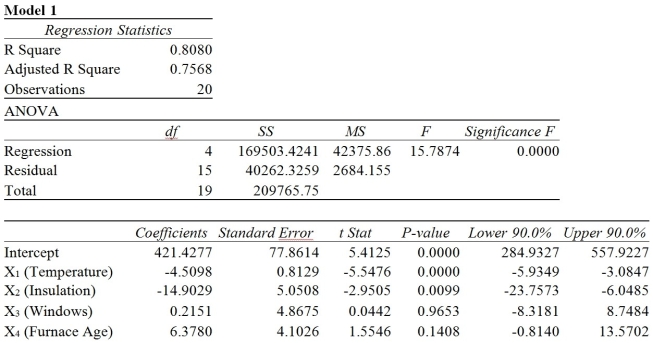
-Referring to Table 13-6, what can we say about Model 1?
A) The model explains 77.7% of the sample variability of heating costs; after correcting for the degrees of freedom, the model explains 75.1% of the sample variability of heating costs.
B) The model explains 75.1% of the sample variability of heating costs; after correcting for the degrees of freedom, the model explains 77.7% of the sample variability of heating costs.
C) The model explains 80.8% of the sample variability of heating costs; after correcting for the degrees of freedom, the model explains 75.7% of the sample variability of heating costs.
D) The model explains 75.7% of the sample variability of heating costs; after correcting for the degrees of freedom, the model explains 80.8% of the sample variability of heating costs.
Correct Answer:

Verified
Correct Answer:
Verified
Q1: Consider a regression in which b₂ =
Q11: TABLE 13-2<br>A professor of industrial relations believes
Q12: TABLE 13-6<br>One of the most common questions
Q13: TABLE 13-7<br>The department head of the accounting
Q14: TABLE 13-14<br>An automotive engineer would like to
Q15: TABLE 13-5<br>A microeconomist wants to determine how
Q17: TABLE 13-15<br>The superintendent of a school district
Q18: TABLE 13-5<br>A microeconomist wants to determine how
Q20: TABLE 13-5<br>A microeconomist wants to determine how
Q21: TABLE 13-17<br>Given below are results from the