Short Answer
TABLE 13-17
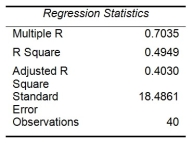
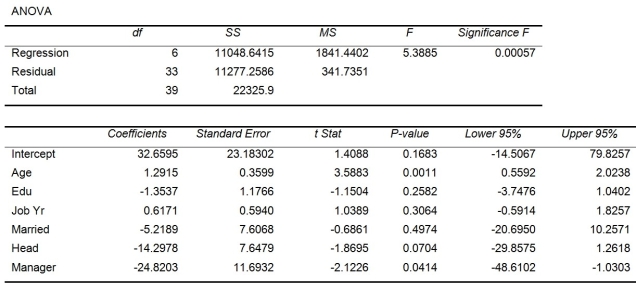
Given below are results from the regression analysis where the dependent variable is the number of weeks a worker is unemployed due to a layoff (Unemploy) and the independent variables are the age of the worker (Age), the number of years of education received (Edu), the number of years at the previous job (Job Yr), a dummy variable for marital status (Married: 1 = married, 0 = otherwise), a dummy variable for head of household (Head: 1 = yes, 0 = no) and a dummy variable for management position (Manager: 1 = yes, 0 = no). We shall call this Model 1.


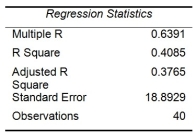
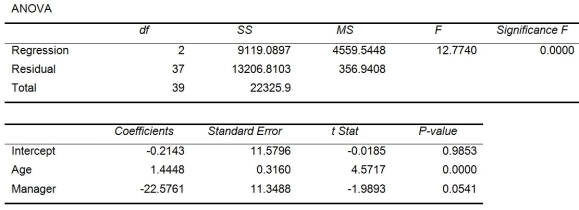
Model 2 is the regression analysis where the dependent variable is Unemploy and the independent variables are Age and Manager. The results of the regression analysis are given below:


-Referring to Table 13-17 Model 1, what is the p-value of the test statistic when testing whether being married or not makes a difference in the mean number of weeks a worker is unemployed due to a layoff, while holding constant the effect of all the other independent variables?
Correct Answer:

Verified
Correct Answer:
Verified
Q144: TABLE 13-5<br>A microeconomist wants to determine how
Q145: TABLE 13-15<br>The superintendent of a school district
Q146: TABLE 13-10<br>You worked as an intern at
Q147: TABLE 13-16<br>What are the factors that determine
Q148: TABLE 13-5<br>A microeconomist wants to determine how
Q151: TABLE 13-16<br>What are the factors that determine
Q152: TABLE 13-15<br>The superintendent of a school district
Q153: TABLE 13-17<br>Given below are results from the
Q154: TABLE 13-8<br>A financial analyst wanted to examine
Q169: When a dummy variable is included in