Multiple Choice
TABLE 13-5
A microeconomist wants to determine how corporate sales are influenced by capital and wage spending by companies. She proceeds to randomly select 26 large corporations and record information in millions of dollars. The Microsoft Excel output below shows results of this multiple regression.
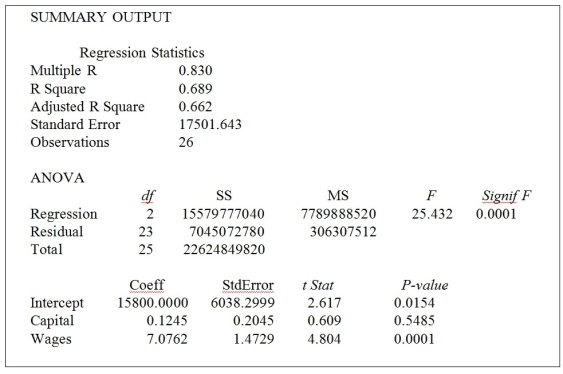
-Referring to Table 13-5, what fraction of the variability in sales is explained by spending on capital and wages?
A) 27.0%
B) 50.9%
C) 68.9%
D) 83.0%
Correct Answer:

Verified
Correct Answer:
Verified
Q139: TABLE 13-17<br>Given below are results from the
Q140: TABLE 13-16<br>What are the factors that determine
Q141: TABLE 13-4<br>A real estate builder wishes to
Q142: TABLE 13-17<br>Given below are results from the
Q143: TABLE 13-3<br>An economist is interested to see
Q145: TABLE 13-15<br>The superintendent of a school district
Q146: TABLE 13-10<br>You worked as an intern at
Q147: TABLE 13-16<br>What are the factors that determine
Q148: TABLE 13-5<br>A microeconomist wants to determine how
Q149: TABLE 13-17<br>Given below are results from the