True/False
TABLE 13-17
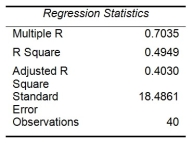
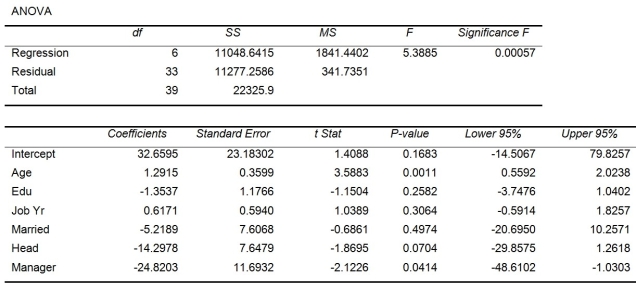
Given below are results from the regression analysis where the dependent variable is the number of weeks a worker is unemployed due to a layoff (Unemploy) and the independent variables are the age of the worker (Age), the number of years of education received (Edu), the number of years at the previous job (Job Yr), a dummy variable for marital status (Married: 1 = married, 0 = otherwise), a dummy variable for head of household (Head: 1 = yes, 0 = no) and a dummy variable for management position (Manager: 1 = yes, 0 = no). We shall call this Model 1.


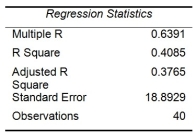
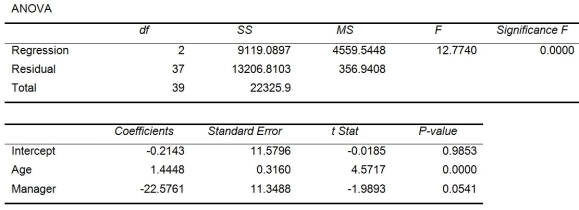
Model 2 is the regression analysis where the dependent variable is Unemploy and the independent variables are Age and Manager. The results of the regression analysis are given below:


-Referring to Table 13-17 Model 1, we can conclude that, holding constant the effect of the other independent variables, there is a difference in the mean number of weeks a worker is unemployed due to a layoff between a worker who is married and one who is not at a 5% level of significance if we use only the information of the 95% confidence interval estimate for β₄.
Correct Answer:

Verified
Correct Answer:
Verified
Q137: TABLE 13-4<br>A real estate builder wishes to
Q138: TABLE 13-1<br>A manager of a product sales
Q139: TABLE 13-17<br>Given below are results from the
Q140: TABLE 13-16<br>What are the factors that determine
Q141: TABLE 13-4<br>A real estate builder wishes to
Q143: TABLE 13-3<br>An economist is interested to see
Q144: TABLE 13-5<br>A microeconomist wants to determine how
Q145: TABLE 13-15<br>The superintendent of a school district
Q146: TABLE 13-10<br>You worked as an intern at
Q147: TABLE 13-16<br>What are the factors that determine