Multiple Choice
TABLE 14- 1
A local newspaper has 10 delivery boys who each deliver the morning paper to 50 customers every day. The owner decides to record the number of papers delivered on time for a 10-day period for one of the delivery boys and construct a p chart to see whether the percentage is too erratic.
Number of Papers
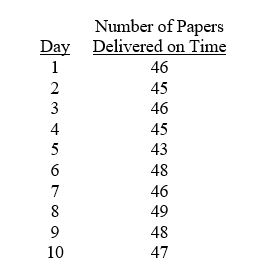
-Referring to Table 14- 1, what is the numerical value of the center line for the p chart?
A) 0.926
B) 0.911
C) 0.885
D) 0.500
Correct Answer:

Verified
Correct Answer:
Verified
Q7: TABLE 14-3<br>A quality control analyst for a
Q9: TABLE 14- 1<br>A local newspaper has 10
Q10: TABLE 14-8<br>Recently, a university switched to a
Q12: TABLE 14-3<br>A quality control analyst for a
Q13: TABLE 14-3<br>A quality control analyst for a
Q14: TABLE 14-7<br>A supplier of silicone sheets for
Q15: TABLE 14-7<br>A supplier of silicone sheets for
Q16: TABLE 14-8<br>Recently, a university switched to a
Q55: The R chart is a control chart
Q97: The p chart is a control chart