Multiple Choice
TABLE 14-3
A quality control analyst for a light bulb manufacturer is concerned that the time it takes to produce a batch of light bulbs is too erratic. Accordingly, the analyst randomly surveys 10 production periods each day for 14 days and records the sample mean and range for each day.
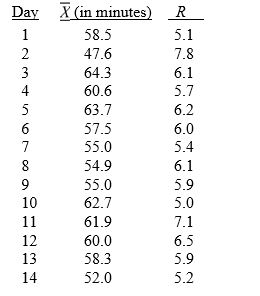
-Referring to Table 14-3, suppose the analyst constructs an  chart to see if the production process is in control. What is the center line for this chart?
A) 64.3
B) 59.5
C) 58.0
D) 57.1
Correct Answer:

Verified
Correct Answer:
Verified
Q7: TABLE 14-3<br>A quality control analyst for a
Q9: TABLE 14- 1<br>A local newspaper has 10
Q10: TABLE 14-8<br>Recently, a university switched to a
Q11: TABLE 14- 1<br>A local newspaper has 10
Q13: TABLE 14-3<br>A quality control analyst for a
Q14: TABLE 14-7<br>A supplier of silicone sheets for
Q15: TABLE 14-7<br>A supplier of silicone sheets for
Q16: TABLE 14-8<br>Recently, a university switched to a
Q17: TABLE 14-9<br>The manufacturer of canned food constructed
Q97: The p chart is a control chart