Multiple Choice
TABLE 14-3
A quality control analyst for a light bulb manufacturer is concerned that the time it takes to produce a batch of light bulbs is too erratic. Accordingly, the analyst randomly surveys 10 production periods each day for 14 days and records the sample mean and range for each day.
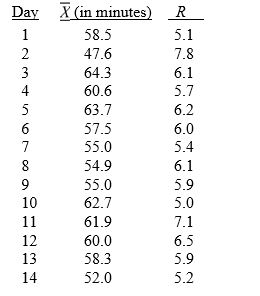
-Referring to Table 14-3, suppose the analyst constructs an R chart to see if the variability in production times is in control. What is the lower control limit for this R chart?
A) 4.84
B) 3.37
C) 2.98
D) 1.34
Correct Answer:

Verified
Correct Answer:
Verified
Q61: TABLE 14-9<br>The manufacturer of canned food constructed
Q62: TABLE 14-7<br>A supplier of silicone sheets for
Q63: TABLE 14-5<br>A manufacturer of computer disks took
Q65: TABLE 14-9<br>The manufacturer of canned food constructed
Q66: TABLE 14-4<br>A factory supervisor is concerned that
Q67: TABLE 14-9<br>The manufacturer of canned food constructed
Q68: TABLE 14-8<br>Recently, a university switched to a
Q69: TABLE 14-7<br>A supplier of silicone sheets for
Q91: Special or assignable causes of variation are
Q147: Changes in the system to reduce common