Multiple Choice
TABLE 14-4
A factory supervisor is concerned that the time it takes workers to complete an important production task (measured in seconds) is too erratic and adversely affects expected profits. The supervisor proceeds by randomly sampling 5 individuals per hour for a period of 10 hours. The sample mean and range for each hour are listed below.
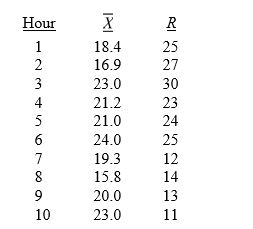
She also decides that lower and upper specification limit for the critical-to-quality variable should be 10 and 30 seconds, respectively.
-Referring to Table 14-4, suppose the supervisor constructs an R chart to see if the variability in collection times is in control. What are the lower and upper control limits for this R chart?
A) -2.33, 43.13
B) -2.28, 42.28
C) 0, 42.28
D) 0, 43.13
Correct Answer:

Verified
Correct Answer:
Verified
Q61: TABLE 14-9<br>The manufacturer of canned food constructed
Q62: TABLE 14-7<br>A supplier of silicone sheets for
Q63: TABLE 14-5<br>A manufacturer of computer disks took
Q64: TABLE 14-3<br>A quality control analyst for a
Q65: TABLE 14-9<br>The manufacturer of canned food constructed
Q67: TABLE 14-9<br>The manufacturer of canned food constructed
Q68: TABLE 14-8<br>Recently, a university switched to a
Q69: TABLE 14-7<br>A supplier of silicone sheets for
Q70: TABLE 14-6<br>The maker of a packaged candy
Q71: TABLE 14-9<br>The manufacturer of canned food constructed