Multiple Choice
TABLE 14-3
A quality control analyst for a light bulb manufacturer is concerned that the time it takes to produce a batch of light bulbs is too erratic. Accordingly, the analyst randomly surveys 10 production periods each day for 14 days and records the sample mean and range for each day.
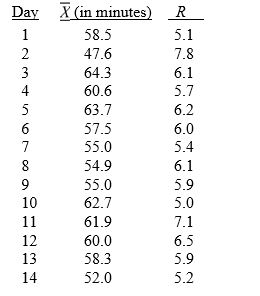
-Referring to Table 14-3, suppose the analyst constructs an R chart to see if the variability in production times is in control. What is the upper control limit for this R chart?
A) 10.66
B) 9.37
C) 7.98
D) 6.34
Correct Answer:

Verified
Correct Answer:
Verified
Q2: TABLE 14-5<br>A manufacturer of computer disks took
Q4: TABLE 14-8<br>Recently, a university switched to a
Q5: TABLE 14-6<br>The maker of a packaged candy
Q7: TABLE 14-3<br>A quality control analyst for a
Q9: TABLE 14- 1<br>A local newspaper has 10
Q10: TABLE 14-8<br>Recently, a university switched to a
Q11: TABLE 14- 1<br>A local newspaper has 10
Q55: The R chart is a control chart
Q73: Common causes of variation represent variation due
Q97: The p chart is a control chart