Multiple Choice
TABLE 14-3
A quality control analyst for a light bulb manufacturer is concerned that the time it takes to produce a batch of light bulbs is too erratic. Accordingly, the analyst randomly surveys 10 production periods each day for 14 days and records the sample mean and range for each day.
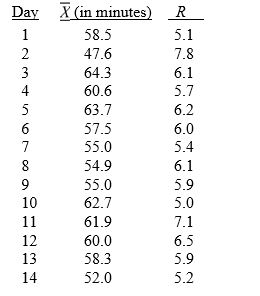
-Referring to Table 14-3, suppose the sample mean and range data were based on 11 observations per day instead of 10. How would this change affect the lower and upper control limits of the R chart?
A) LCL would increase; UCL would decrease.
B) LCL would remain the same; UCL would decrease.
C) Both LCL and UCL would remain the same.
D) LCL would decrease; UCL would increase.
Correct Answer:

Verified
Correct Answer:
Verified
Q85: One of the morals of the red
Q97: TABLE 14-4<br>A factory supervisor is concerned that
Q98: TABLE 14-6<br>The maker of a packaged candy
Q99: The principal focus of the control chart
Q101: TABLE 14-5<br>A manufacturer of computer disks took
Q102: TABLE 14- 1<br>A local newspaper has 10
Q103: TABLE 14-8<br>Recently, a university switched to a
Q104: TABLE 14-2<br>A political pollster randomly selects a
Q106: TABLE 14-2<br>A political pollster randomly selects a
Q107: TABLE 14-9<br>The manufacturer of canned food constructed