Short Answer
TABLE 14-6
The maker of a packaged candy wants to evaluate the quality of her production process. On each of 16 consecutive days, she samples 600 bags of candy and determines the number in each day's sample that she considers to be of poor quality. The data that she developed follow. 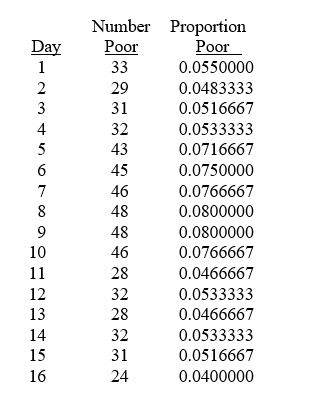
-Referring to Table 14-6, a p control chart is to be constructed for these data. The center line for the chart should be located at ________.
Correct Answer:

Verified
Correct Answer:
Verified
Q85: One of the morals of the red
Q93: TABLE 14-9<br>The manufacturer of canned food constructed
Q94: Which of the following situations suggests a
Q95: TABLE 14-6<br>The maker of a packaged candy
Q96: TABLE 14-9<br>The manufacturer of canned food constructed
Q97: TABLE 14-4<br>A factory supervisor is concerned that
Q99: The principal focus of the control chart
Q101: TABLE 14-5<br>A manufacturer of computer disks took
Q102: TABLE 14- 1<br>A local newspaper has 10
Q103: TABLE 14-8<br>Recently, a university switched to a