Graph 15-1 -Refer to Graph 15-1.The Shape of the Average-Total-Cost Curve in Average-Total-Cost
Multiple Choice
Graph 15-1 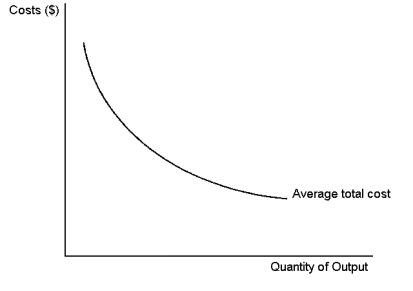
-Refer to Graph 15-1.The shape of the average-total-cost curve in the figure suggests an opportunity for a profit-maximising monopolist to exploit:
A) price discrimination
B) average cost pricing
C) economies of scale
D) diminishing marginal product
Correct Answer:

Verified
Correct Answer:
Verified
Q108: For price discrimination to be feasible it
Q109: If a monopoly sells its good at
Q110: When a monopolist increases the number of
Q111: Graph 15-1 <img src="https://d2lvgg3v3hfg70.cloudfront.net/TB8859/.jpg" alt="Graph 15-1
Q112: A significant difference between a competitive firm
Q114: When a firm operates under conditions of
Q115: Consider the following graph of a monopoly.
Q116: Compared to the output in a competitive
Q117: Graph 15-2 <img src="https://d2lvgg3v3hfg70.cloudfront.net/TB8859/.jpg" alt="Graph 15-2
Q118: A firm's supply curve in a competitive