Multiple Choice
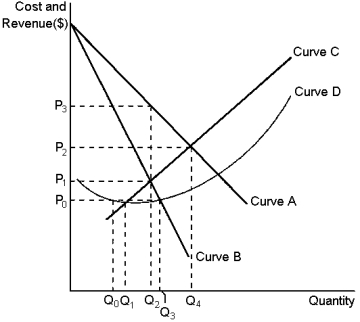
Graph 15-2  This graph reflects the cost and revenue structure for a monopoly firm.Use the graph to answer the following question(s) .
-Refer to Graph 15-2.The marginal-cost curve for a monopoly firm is depicted by curve:
A) A
B) B
C) C
D) D
Correct Answer:

Verified
Correct Answer:
Verified
Q46: Describe how government is involved in creating
Q112: A significant difference between a competitive firm
Q113: Graph 15-1 <img src="https://d2lvgg3v3hfg70.cloudfront.net/TB8859/.jpg" alt="Graph 15-1
Q114: When a firm operates under conditions of
Q115: Consider the following graph of a monopoly.
Q116: Compared to the output in a competitive
Q118: A firm's supply curve in a competitive
Q120: Patent and copyright laws are major sources
Q121: Marginal revenue for a monopolist is computed
Q122: Table 15-1<br> <span class="ql-formula" data-value="\begin{array}