Multiple Choice
Graph 13-5 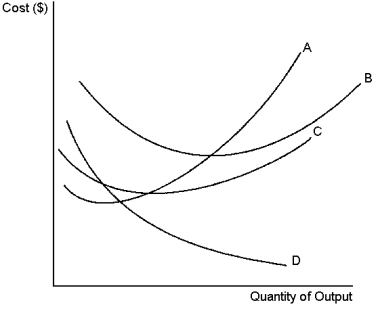 The set of curves above reflect information about the cost structure of a firm.Use this graph to answer the following question(s) .
-Refer to Graph 13-5.Which of the curves is most likely to represent average fixed cost?
A) A
B) B
C) C
D) D
Correct Answer:

Verified
Correct Answer:
Verified
Q1: Mosti, a materials engineer, has discovered a
Q2: Graph 13-2 <img src="https://d2lvgg3v3hfg70.cloudfront.net/TB8859/.jpg" alt="Graph 13-2
Q3: Average total cost equals:<br>A)change in total costs
Q4: Those things that must be forgone to
Q5: Specialisation among workers occurs when:<br>A)each worker is
Q7: Diminishing marginal product occurs:<br>A)immediately after the first
Q8: The amount of money that a firm
Q9: Graph 13-6 <img src="https://d2lvgg3v3hfg70.cloudfront.net/TB8859/.jpg" alt="Graph 13-6
Q10: The marginal cost curve will intersect:<br>A)average variable
Q11: If a firm mothballs a factory so