Multiple Choice
Graph 13-6 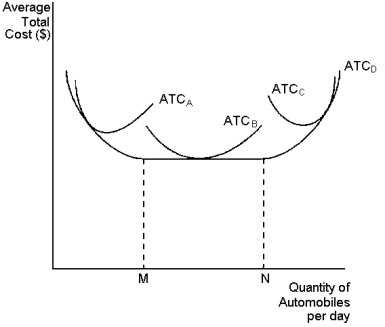 This graph depicts average total cost functions for a firm that produces automobiles.Use the graph to answer the following question(s) .
-Refer to Graph 13-6.At levels of output below point M, the firm experiences:
A) economies of scale
B) accounting profit
C) economic profit
D) diseconomies of scale
Correct Answer:

Verified
Correct Answer:
Verified
Q4: Those things that must be forgone to
Q5: Specialisation among workers occurs when:<br>A)each worker is
Q6: Graph 13-5 <img src="https://d2lvgg3v3hfg70.cloudfront.net/TB8859/.jpg" alt="Graph 13-5
Q7: Diminishing marginal product occurs:<br>A)immediately after the first
Q8: The amount of money that a firm
Q10: The marginal cost curve will intersect:<br>A)average variable
Q11: If a firm mothballs a factory so
Q12: From a firm's costs perspective, the long
Q13: Costs that have already been incurred and
Q14: Constant returns to scale occur when:<br>A)long-run average