Multiple Choice
Graph 10-2 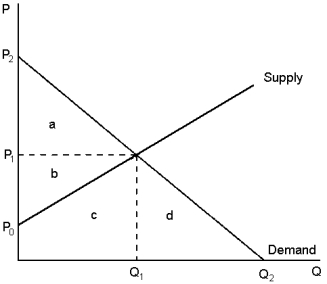 This graph depicts the market for pork.Use this information to answer the following question(s) .
-In Graph 10-2, what price and quantity combination efficiently allocates resources in such a way that the total value to consumers who buy and use pork minus the total costs to the producers who make and sell pork is maximised?
A) P₁, Q₁
B) P₂, quantity of zero
C) price of zero, Q₂
D) P₀, Q₂
Correct Answer:

Verified
Correct Answer:
Verified
Q135: Graph 10-3 <img src="https://d2lvgg3v3hfg70.cloudfront.net/TB8859/.jpg" alt="Graph 10-3
Q136: Policy responses that try to deal with
Q137: Suppose that a fish-food manufacturing company is
Q138: Negative externalities occur when one person's actions:<br>A)cause
Q139: The height of the demand curve for
Q141: Internalising a negative consumption externality will cause
Q142: Which of the following could be associated
Q143: Suppose people plant flowering trees near their
Q144: Which of the following is one problem
Q145: Which policy would best suit a positive