Multiple Choice
Graph 10-3 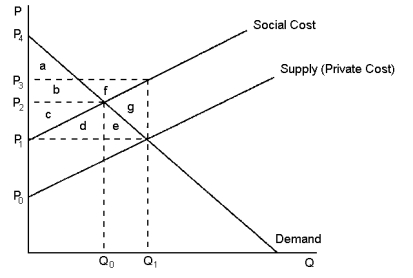 This graph reflects the market for kiwifruit, where pesticide used by kiwifruit orchardists also unintentionally kills honey bees.
-Refer to Graph 10-3.The difference between the social cost curve and the supply curve reflects the:
A) profit margin of each kiwifruit tray
B) cost of spillover effects from the kiwifruit orchards (replacing bees, lost honey output)
C) value of kiwifruit to society as a whole
D) amount by which the government should subsidise the kiwifruit orchardists
Correct Answer:

Verified
Correct Answer:
Verified
Q130: Japanese fishermen use gill nets to catch
Q131: The sound of birds singing from a
Q132: Emission controls on automobiles provide an example
Q133: Which of the following best defines the
Q134: When Jake takes into account how his
Q136: Policy responses that try to deal with
Q137: Suppose that a fish-food manufacturing company is
Q138: Negative externalities occur when one person's actions:<br>A)cause
Q139: The height of the demand curve for
Q140: Graph 10-2 <img src="https://d2lvgg3v3hfg70.cloudfront.net/TB8859/.jpg" alt="Graph 10-2