Multiple Choice
Graph 8-2 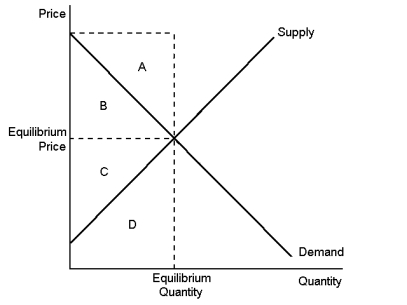 This graph shows supply and demand in a free market.
-According to Graph 8-2, total economic surplus would be represented by area:
A) A + B
B) B + C
C) C + D
D) A + D
Correct Answer:

Verified
Correct Answer:
Verified
Related Questions
Q46: If the size of a tax doubles,the
Q125: Suppose supply is perfectly inelastic, while demand
Q126: The 'underground' economy includes:<br>A)the mining industry<br>B)the illegal
Q127: The Laffer curve indicates that income tax
Q128: The more inelastic the supply and demand
Q129: Use the graph below to fill
Q130: When a tax on a good is
Q131: When a tax is levied on a
Q132: Graph 8-3 <img src="https://d2lvgg3v3hfg70.cloudfront.net/TB8859/.jpg" alt="Graph 8-3
Q133: A tax levied on the supplier of